for Insurance firms
Bottom-up cost analysis of IT estates at speed to build momentum, confidence, and profitability


Strategy Consultants handle diverse projects with a common theme: “Advanced Current State Cost Analysis & Scenario Modelling for potential Target States”
With Technology becoming ever more complex, Cost analysis and associated modelling requires a lot more sophistication than what Excel proffers
In an age of higher interest rates, talent constraints, and complex emerging Tech (eg AI) – Consultants need to do more to convince clients in adopting Digital Transformation initiatives
All within the typical 8-12weeks project cycle.
Traditional top-down, excel based techniques aren’t adept at handling the complexity of modern enterprises

Build strategic client relationships to avoid multiple points of failure
According to the reputed Consultants, Bain Research, the success record of Technology Cost Programs is poor

90%
of companies have run Technology Cost Programs recently

75%
of companies didn't achieve their cost targets

50%
missed targets by more than 50%. Exited costs creeped
The current process to Technology Cost Analysis is manual and error-prone
"Excel-magic" has its limitations.
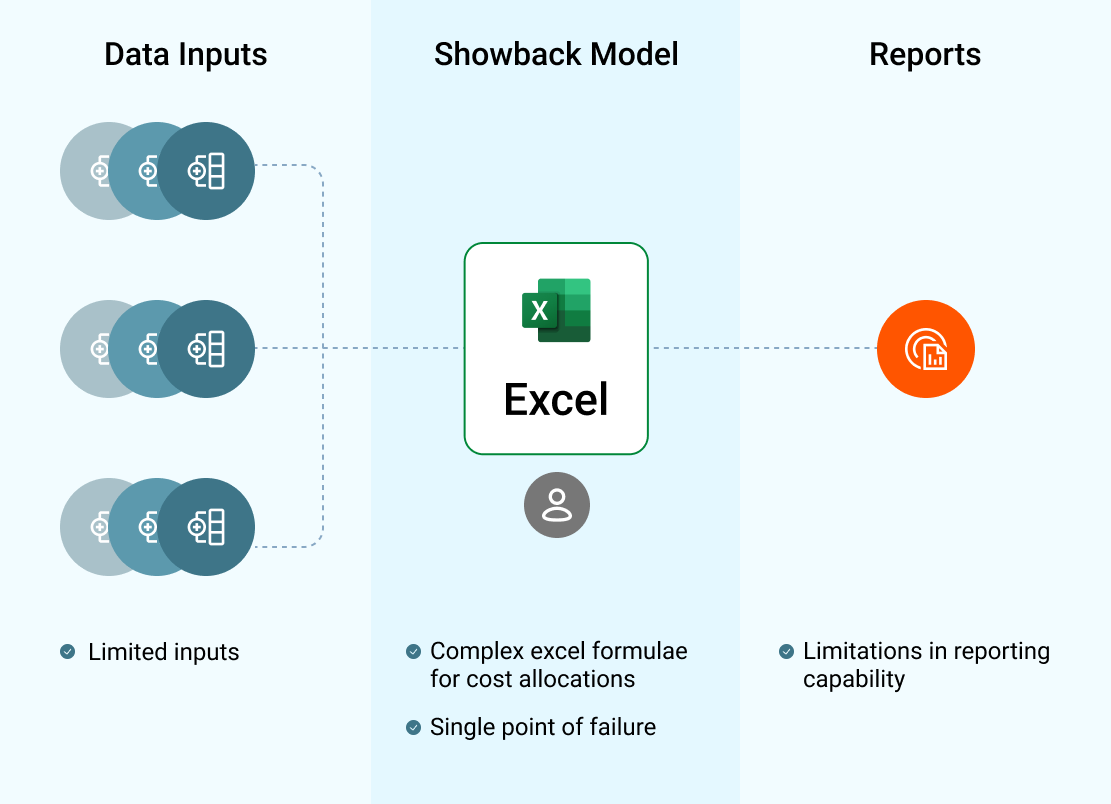
Lack of clear understanding of Technology spend
There are significant operational limitations with bottom-up, granular cost data and cost levers - all of which impacts the granularity, transparency and level of benchmark insights that can be generated
Difficulty in painting the financial picture of your proposed Target & Interim states
Ease of scenario modelling ensures you are able to easily and quickly model various scenarios, compare any two of them to demonstrate
Nervous of adopting emerging Technology such as AI
Typical capital investments are made using manual computations on a case-by-case basis using spreadsheets. The complexity of emerging technology with its complex architectures necessiates a standards-based Cost Model that can convince skeptical clients of the associated benefits
CostLens provides Consultants with advanced capability to cut to the cost problems at speed

CostLens is Technology Cost Management software for hybrid, multi-cloud teams that enables granular cost control, demonstrates value and improves confidence in investment decisions.
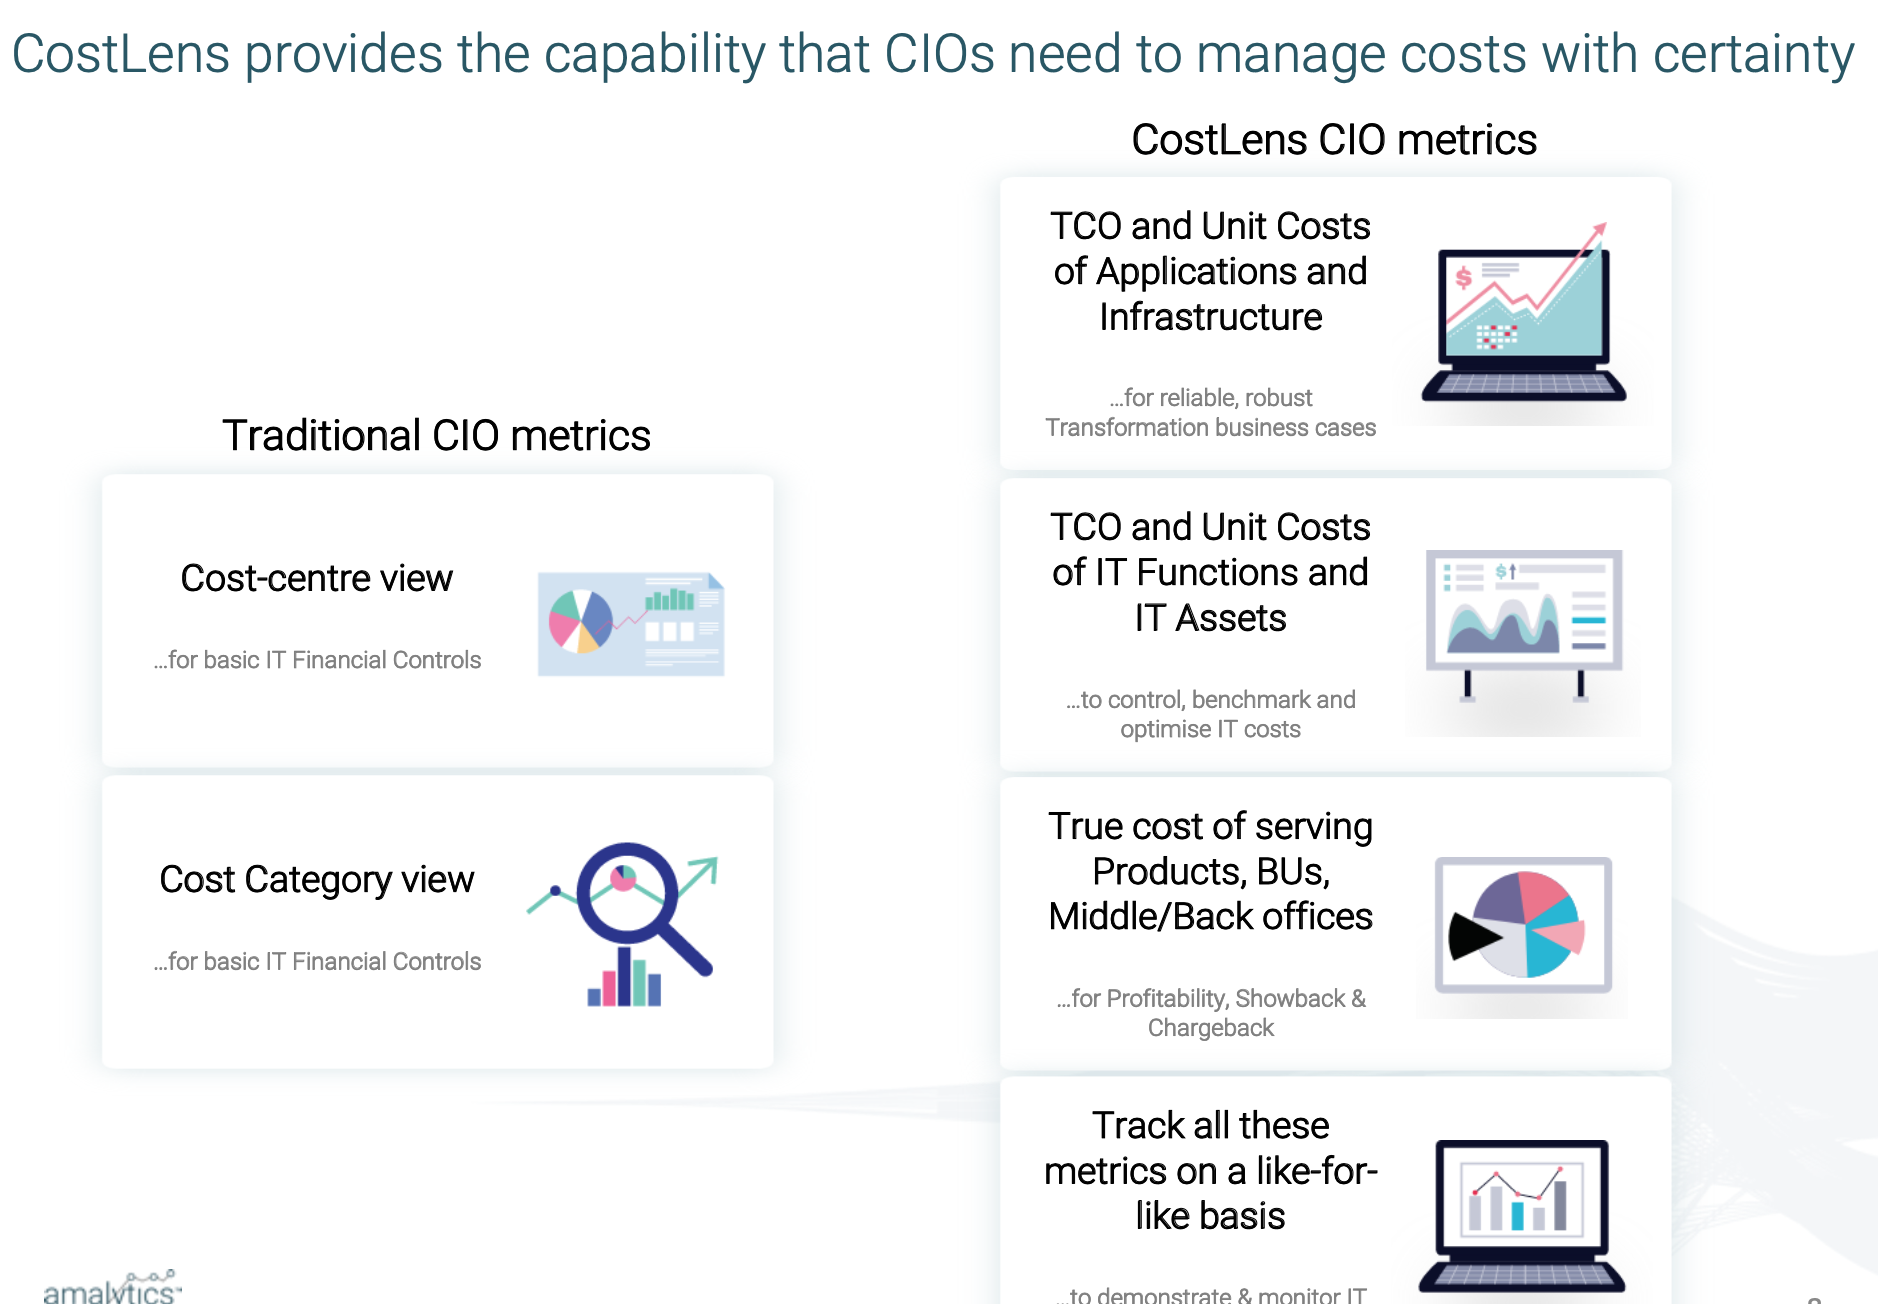
CostLens generates advanced metrics for market-leading cost analysis approaches
It enables Consultants to take a triangulation basis to Cost Analysis
Target-setting approach
aka Benchmark-driven approach that matches competitor or aim for best-in-class
Strategy-backed approach
aka fit-for-growth approach that reduces the 'bad' and protects the 'good'
Cost of Functional Capabilities with associated breakdown breakdown
TCO of Service Capabilities with associated breakdown
Fully loaded cost of servicing Corporate Functions & Products
Benchmarks
Unit Costs
Breakdown by Cost Pools aka Assets
Breakdown by Cost Categories
TCO of Services
CostLens surfaces 'WHY' particular cost areas are high by analysing multiple perspectives to determine root-cause
Macro-level
Macro-level
Macro-level benchmarks
Compares your organisation vs others in the sector in terms of high-level metrics such ads IT Opex as % of overall Opex, IT Spend per employee, Opex vs Capex split, etc

Operating Model
Operating Model
Operating Model benchmarks
Compares your current Operating Model vs others in relation to key cateogries such as Personnel, Outsourcing, Hardware, Software, etc
Tower-level
Tower-level
Tower-level Benchmarks
Compares your current Functional Towers vs others in relation to key categories such as Infrastructure, End User Computing, IT Security, Service Desk, etc
Infrastructure
Infrastructure
Infrastructure Benchmarks
Facilitates a deeper level of drill-down of your infrastructure into the key sub-categories such as Compute, Database, Datacentre, Middleware, Storage, etc
Unit Cost economics
Unit cost economics
Unit Cost Benchmarks
Compares key spend areas to identify cost efficiency metrics such as cost per ticket, cost per Windows instance, cost per TB of storage, etc
Productivity metrics
Productivity metrics
Productivity Benchmarks
Focuses on productivity metrics such as workload supported per Service Desk FTE, no. of Windows servers supported by FTE, etc
Corporate Support Functions
Corporate Support Functions
Corporate Functions TCOs
Focuses on the cost of supporting the Corporate Functions vs peers. Examples include TCO of supporting Finance, HR, applications etc
Business Unit demand
Business Unit demand
Business Unit Benchmarks
This benchmark splits the cost in line with front-office BUs such as Asset Management and Wealth; and considers the cost of supporting the size of the business in line with Business metrics such as AUM, No. of Policies, IT Cost-Income ratio, etc
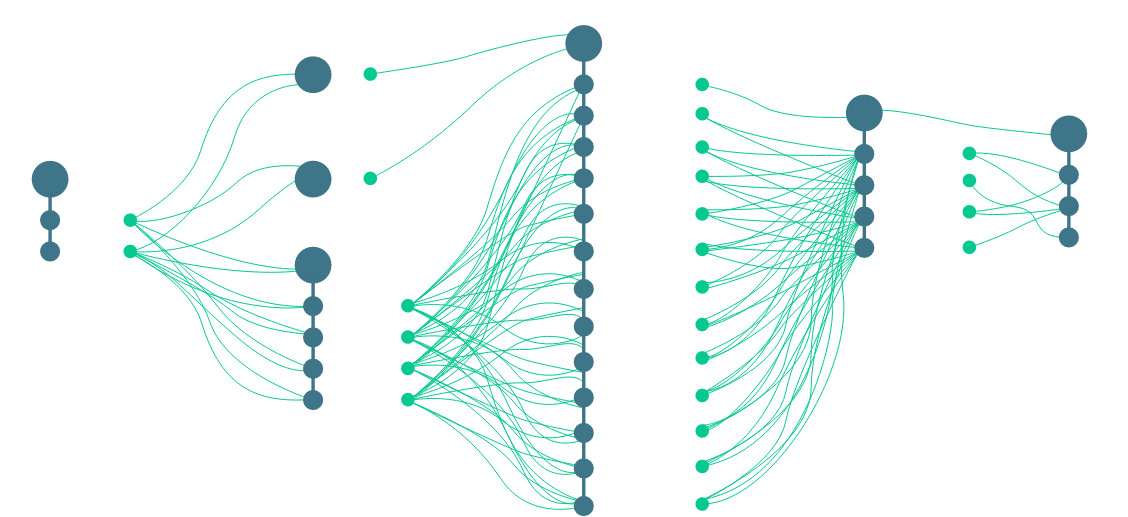
CostLens is the only tool that builds cost traceability across complex shared Technology enterprises
Automate Showback /Chargeback charges
Best Practice Reports automated right-down to the Product level with granular permissions control
.png)
Automate time-consuming BU-level variance reporting
articulate cost reductions despite other cost uplifts

One version of the truth with well understood end-to-end ripple impact of cost decisions
Aggregation , classification & modelling of Technology costs to industry standards
Improve ease of Scenario Modelling & Analysis
Compare Current State vs multiple Target States to outlines cost-benefit options
CostLens brings the power of big-data analytics to deliver huge benefits
Generates advanced metrics of complex cost structures
such as Unit Costs of Infrastructure

Consumption-based billing
drives changes to behaviour
~ 80%
typical reductions in manual effort when compared to Excel
Articulate business-led demand
Consumption-driven cost increases drives accountability
Offers transparency of opaque costs
Technology costs expressed in terms the business understands
Drives shared accountability
Consumption-based charges drives accountability of cost levers
Surface true BU/ Product profitability
improved product investment decisions
indirect benefits
Transparency offers a sense of control
Lorem ipsum dolor sit amet, consectetur adipiscing elit. Suspendisse varius enim in eros.
Improve confidence in investment decisions
Generate accurate metrics for robust, reliable decisions such as TCO (Total Cost of Ownership), Fully loaded costs, Unit Costs
Improves agility
Lorem ipsum dolor sit amet, consectetur adipiscing elit. Suspendisse varius enim in eros.
Enables Cost Optimisation
Lorem ipsum dolor sit amet, consectetur adipiscing elit. Suspendisse varius enim in eros.
Demonstrates the value of shared costs
Lorem ipsum dolor sit amet, consectetur adipiscing elit. Suspendisse varius enim in eros.
Lower structural costs by 15% - 20%
Lorem ipsum dolor sit amet, consectetur adipiscing elit. Suspendisse varius enim in eros.
Request custom demo
If you would like to understand our product better select from one of the options.
or, contact sales@amalytics.co for RfP invites